October 2013 – An Economic and Market Update
EXECUTIVE SUMMARY
- The economy appears to be slowing down. The most recent GDP growth rate is below both the GDP historic average and the GDP average since the recovery began in 2009 [i].
- Housing has continued to perform well but interest rate increases may begin to slow demand [ii].
- Domestic equity valuation measurements seem to suggest pricing is fair. While it may not be a bubble, stock prices are still elevated [iii].
- Emerging economies have provided a large boost to global GDP growth over the last 20 years, but have been calm as of late due to less demand for products and services they produce from the developed countries [iv].
| MAJOR STOCK INDICES | YTD 2013 |
| S&P 500 | +19.44% |
| Russell 2000 | +26.75% |
| S&P GSCI Index | -.95% |
| Barclays Bond Agg | -1.88% |
| MSCI EAFA | +14.96% |
| Wilshire US REIT | +2.20% |
January 1, 2013 to September 30, 2013 | |
ECONOMIC OUTLOOK
The U.S. economy is in a state of fluctuation as we move into the last quarter of 2013. Second quarter Gross Domestic Product (GDP) grew at a 1.7% annualized rate, which is considered mediocre when compared to the bar set since the recovery began in 2009. The long term growth average for GDP is 3%, while since the economic recovery began, GDP has averaged 2.2% [v].
The slowed economic recovery continues to keep the Federal Reserve in a difficult position. Over the last year contradictory statements have been made by the Federal Reserve, first suggesting a “tapering” of the QE3 bond buying program and more recently, by declaring their commitment to the continuation of the program[vi]. It is apparent that the lack of growth is frustrating policymakers, economists and the Federal Reserve alike.
Consumer Spending
Consumer spending has received the most attention in prior quarters as the primary culprit for slowed growth. Spreading the blame for a slowdown on consumers is difficult this time around. Consumers are purchasing more cars as new car sales were reported at a seasonally adjusted rate of 15.3 million units [vii]. This is above the long term average of 15.2 million units. Consumers are feeling wealthier as household net worth is now at a historic high of $76,442, indicative of the recovery in housing values. Consumers are spending more money as personal savings rates have trended back down towards the 2% of earnings as seen pre-crisis [viii].
In summary, spending is up, saving is down and consumers are now doing their part to push the market uphill.
Housing
The housing recovery continues to roll along as well. The S&P/Case-Shiller 20-city home price index, up most recently by 1.84%, is up a total of 12.39% year-over-year [ix]. Prices have been increasing for some time now, however, basic supply and demand are now the driving factor. Far fewer bank owned, foreclosed and REO properties trading at discounts are to be found. Another factor causing the current low supply is that some potential sellers who are still on the sidelines, waiting to sell until they are above water.
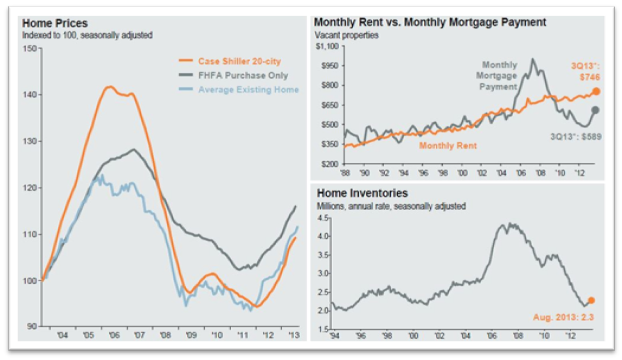
Sources: (Left) National Association of Realtors, Standard & Poor’s, FHFA, FactSet, J.P. Morgan Asset Management. (Top right)Census Bureau, J.P. Morgan Asset Management. Monthly mortgage payment assumes a 20% down payment at prevailing 30-year fixed-rate mortgage rates; analysis based on median asking rent and median mortgage payment based on asking price. (Bottom right) Census Bureau, National Association of Realtors, J.P. Morgan Asset Management. *3Q13 rent and mortgage
payment values are J.P. Morgan Asset Management estimates.
“Guide to the Markets – U.S.”
Relative to renting, mortgages are still cheap on a historic basis even as interest rates have seen a full percentage point rise in the last year. There is likely to be an adjustment phase by home buyers as they begin to match “offer prices to mortgage payments” as dictated by mortgage rates. September 2012 provided a 10-Year Treasury yield of 1.65% versus the current 2.64% [x].
Job Growth
Job growth continues to be a constant source of frustration for everyone. Despite record profits, strong balance sheets at the corporate level, and corporate buybacks of stock, companies are not hiring at rates necessary to push unemployment down towards a more normalized employment rate. While the government shutdown has confounded our ability to get the most recent jobs report, the last reported month which was August, showed a very weak hiring of only 169,000 workers. This has left the unemployment rate at 7.3% [xi].
MARKET OVERVIEW
Fixed Income
Long ago, in the year 2009, it was thought that municipal securities “i.e. municipal bonds” were going to be a problem. While we have not seen the widespread defaults as projected, we have seen precedent setting actions being taken.
At the heart of municipal concerns are pension obligations. Long held sacrosanct and untouchable, cities are beginning to find that it may be necessary to restructure pension obligations in order to set their financial houses in order. The first city to do this was Vallejo, CA. Detroit sought the ability to renegotiate its pension obligations, and while it did not follow through on restructuring, the fact that this tool was granted to them created an enormous “ace up the sleeve” for municipalities struggling under the burden of pension obligations.
A de-levering process is taking place across states and municipalities. To date 2013 is on pace for the fewest new municipal bond issuances since the beginning of the new millennium. As of August 2013 $220 billion in new bond issuances made their way to the market. The State and Local Government Debt Servicing ratio is at 5.2% for Q1 2013. While this is up from the bottom of late 2009, it is substantially below the 7.8% ratio of the early 90’s. [xii]
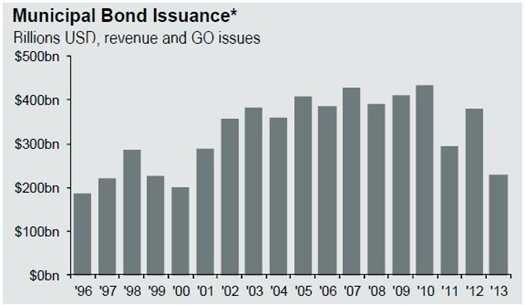
SIFMA,J.P. Morgan Asset Management.*Excludes maturities of 13 months or less and private placements. 2013 issuance data is as of August 2013.
State and local governments continued to be strapped for cash, and have a narrower view of economic improvement than the Federal Government. Washington wants to see a maximization of national economic growth while municipalities are more interested in creating jobs and fostering growth in more localized tax bases. Creating jobs locally is the name of the game for local governments where the failures, such as Detroit, Vallejo, and Stockton, made the news.
Equities
Equities have enjoyed quite a year. Buoyed by the surprise announcement that tapering would not begin, the markets rose higher. However, just like volatility in the markets picked up prior to the Fed announcement, it now appears to be picking up again.
International Developed Markets have been laggard to the US, however recent dollar weakness have helped boost Developed Market stocks 14.96% higher on the year. Emerging markets are the outlier with an annual return to date of – 4.1%.
Emerging market economies have contributed immensely to world economic growth in the last 20 years. While the primary initiators behind this growth have been China and India, other countries have been on the band wagon as well. Per Capita GDP growth in Emerging Markets have far outpaced that of the US. [xiii] The takeaway here is that developed markets have been smaller and smaller contributors to global economic growth.
Growth in emerging markets is expected to continue while developed markets may have less of a share in the global economic pie than in the past. An example of this is the top 50 companies by market value in the world. The US has reemerged as the dominant force in the world’s 10 largest companies with 8 of the top 10 listings. However, when expanding out to the top 50, international companies are dominating, as measured by the Fortune Global 500, with 34 of the top 50 listings. [xiv]
OUR TOUGHTS
Calling a market top or a market bottom is notoriously impossible. Our investment methodology encompasses the principles of Modern Portfolio Theory where measurements of correlation and risk help us to create an appropriate asset allocation strategy. We continue to research and monitor financial markets to protect value and follow through on our mission to provide sound financial advice so that our clients can make good decisions.
We remain committed to both the protection of your assets and the growth of your investment portfolio, and want to thank you for your continued trust and support.
We welcome your input and ask that you contact us with any questions or concerns.
DISCLOSURE:
All information is believed to be from reliable sources; however we make no representation as to its completeness or accuracy. All economic and performance data is historical and not indicative of future results. Market indices discussed are unmanaged. Investors cannot invest in unmanaged indices. Additional risks are associated with international investing, such as currency fluctuations, political and economic instability and differences in accounting standards.
An index is statistical measure of change in an economy or a securities market. In the case of financial markets, an index is an imaginary portfolio of securities representing a particular market or a portion of it. Each index has its own calculation methodology and is usually expressed in terms of a change from a base value. Thus, the percentage change is more important than the actual numeric value. An investment cannot be made directly into an index.
Investing in fixed income securities involves credit and interest rate risk. When interest rates rise, bond prices generally fall. Investing in commodities may involve greater volatility and is not suitable for all investors. Investing in a non-diversified fund that concentrates holdings into fewer securities or industries involves greater risk than investing in a more diversified fund. The equity securities of small companies may not be traded as often as equity securities of large companies so they may be difficult or impossible to sell. Diversification nor asset allocation assure a profit or protect against a loss in declining markets.
Past performance is not an indicator of future results.
Securities offered through 1st Global Capital Corp., Member FINRA and SIPC. Bruce Rawdin-Baron, Steven W. Pollock, Sean Storck and Nicole Albrecht are Registered Representatives of 1st Global Capital Corp. Investment advisory services, including RBFI portfolios offered through Rawdin-Baron Financial, Inc. IMS platform accounts offered through 1st Global Advisors, Inc. Rawdin-Baron Financial, Inc. and 1st Global Capital Corp. are unaffiliated entities. Rawdin-Baron Financial, Inc. is a Registered Investment Adviser. Insurance services offered through 1st Global Insurance Services. Registration does not imply a certain level of skill or training. We currently have individuals licensed to offer securities in the states of Arizona, California, Illinois, Indiana, Kansas, Massachusetts, Michigan, New York, Oregon and Washington. This is not an offer to sell securities in any other state or jurisdiction. CA Department of Insurance License: Bruce Rawdin-Baron #0736631, Steven W. Pollock #OE98073, Sean Storck #0F25995 and Nicole Albrecht #0F99962.
Copyright © 2013 Rawdin-Baron Financial Inc., all rights reserved.
Rawdin-Baron Financial, Inc., 4747 Morena Blvd, Ste 102, San Diego, CA 92117
END NOTES
[i] Bureau of Economic Analysis, www.bea.gov
[ii] S&P/Case-Shiller Home Price Indices, http://us.spindices.com/index-family/real-estate/sp-case-shiller
[iii] Standard & Poor’s, IBES, Factset, JP Morgan Asset Management, Guide to the Markets – U.S.
[iv] JP Morgan Asset Management, Guide to the Markets – U.S.
[v] Bureau of Economic Analysis, www.bea.gov
[vi] Board of Governors of the Federal Reserve System, Press Release date September 18, 2013
[vii] Bureau of Economic Analysis, Factset, JP Morgan Asset Management
[viii] Bureau of Economic Analysis, Federal Reserve Board, Factset, JP Morgan Asset Management
[ix] S&P/Case-Shiller Home Price Indices, http://us.spindices.com/index-family/real-estate/sp-case-shiller
[x] U.S. Department of the Treasury, Daily Treasury Yield Curve Rates, Resource Center, http://www.treasury.gov/resource-center/data-chart-center/interest-rates/Pages/TextView.aspx?data=yield
[xi] Bureau of Labor Statistics
[xii] Bureau of Economic Analysis, http://www.bea.gov
[xiii]The World Bank, World Bank national accounts data, http://data.worldbank.org/indicator/NY.GDP.PCAP.KD.ZG
[xiv] CNNMoney, A Service of CNN, Fortune &Money, Global 500 2013