January 2018 – An Economic and Market Update
Quarterly Market Update – January 2018
Executive Summary
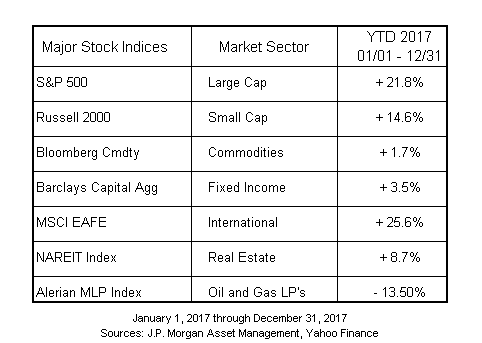
- The last year saw a strong shift in market growth with international markets outpacing the United States.
- Tax reform will take time to fully understand, but currently it looks like most filers will benefit, particularly those who are married with children at home.
- The Federal Reserve and Goldman Sachs agree that economic growth is accelerating, as is inflation. They disagree on how quickly interest rates will rise to keep a handle on price increases.
- Political risks appear to be of more concern right now than economic risks.
Looking Back
2017 In Reverse
An appraisal of last year is best summed up as follows: strong global growth. Despite continued domestic growth, the top performing asset classes of the year were to be found elsewhere. For some time now the disparity between the recovery of the US relative to the rest of the world has stood out as an anomaly. No longer. 2017 was a turn around year with global markets increasing substantially. As in most years, a lot happened which you cannot really remember in the moment, or may not even be aware of. Some significant economic milestones are outlined below in coordination with the performance of the MSCI All Country stock index.
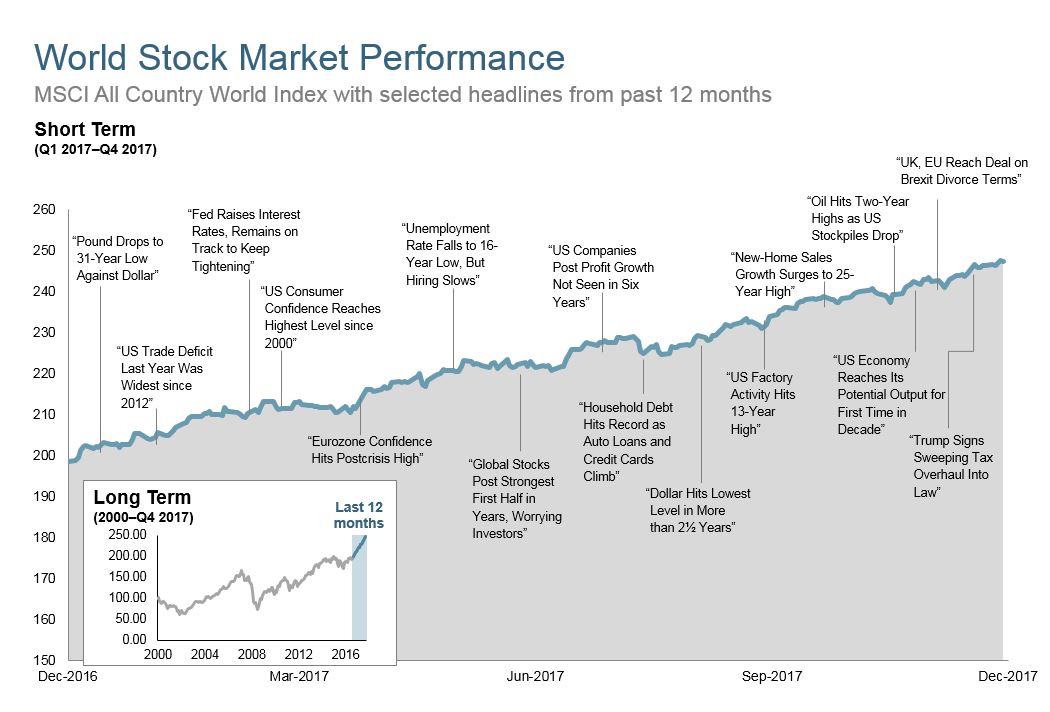
These headlines are not offered to explain market returns. Instead, they serve as a reminder that investors should view daily events from a long-term perspective and avoid making investment decisions based solely on the news. Graph Source: MSCI ACWI Index [net div]. MSCI Data ® MSCI 2018, all rights reserved.
Unlike the experience of watching a cable news channel, it is possible to create a timeline of events which barely mention a certain world leader who casts a long shadow. To put a capstone on 2017, the most impactful tax reform in a generation was enacted just before the Christmas holiday.
Changes to Tax Laws
Final guidance from the Internal Revenue Service on a host of items is still outstanding. Our expectation is that by the time we sit down during tax season we will have a good handle on the consequences for a variety of different filers. We have performed a basic analysis of the proposed changes on a swath of clients which we will share at this time. This is a manual analysis performed using real client prior year data run through a series of formulas in Excel. Our goal was to review the consequences of tax reform on real clients from the lower income strata through the upper middle income. We covered all filing statuses except for Married Filing Separate. A partial, but representative, matrix of the results is found here.

2018 Estimated Tax is based on the 2016 actual data from multiple source cases and extrapolated across the released tax brackets and itemized deduction guidance from Internal Revenue Service regarding implementation of the Tax Cuts and Jobs Act of 2017.
We are unable to go into more complex tax situations such as those involving business owners or significant property holdings. However, the numbers are pretty clear most people will be better off, and a minority will be slightly worse. All of these cases are for California residents, the majority are homeowners, some will be subject to the $10,000 cap on State and Local Tax deductions. The review cases were chosen in such a way as to be most relevant for our client base.
Quick Takeaways:
- The clear winners are married couples with children.
- This has much less profound an impact on individuals than has been reported.
Understanding the tax changes will take time. We hope to provide definitive answers over the coming months as information comes out.
Where are the Markets Going
The stock market in the US is high. So high, in fact, it feels as if there is a dissonance between where we are today and where we feel like we should be. It is the proverbial, “next shoe to drop”, feeling. Impending doom, Eeyore, Charlie Brown trying to kick the football, whatever it may be. This is a great moment to ask ourselves why we feel that way. We prefer to look at this as an example of recency bias. The belief that what happened yesterday, or in this case the 2000’s will happen again today, as in the next 10 or so years.
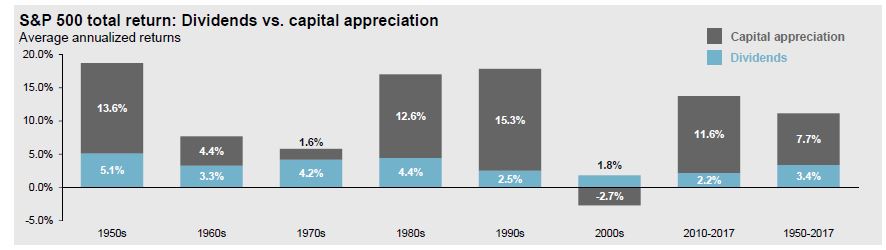
Source: FactSet, J.P. Morgan Asset Management; Ibbotson, Standard & Poor’s, Guide to the Markets – US Data are as of December 31, 2017
We lived through a painful decade and because of that we over-emphasize the experience and presume it will repeat itself. Collectively, it would be useful for us all to accept we are a little older and closer to the 2020’s, no matter how recent the 2000’s might feel. We have come a long way since that time. The internet morphed in to a 24/7 connected world with all of its positives and negatives. Smart phones took over the world and have provided a true medium by which the poor, irrespective of location, can gain access to information and opportunities to make their lives better. Rockets can now make it to space and come back to earth in a controlled descent for future use. The world is changing around us and we have to let go of the experience in the 2000’s to better prepare for the future.
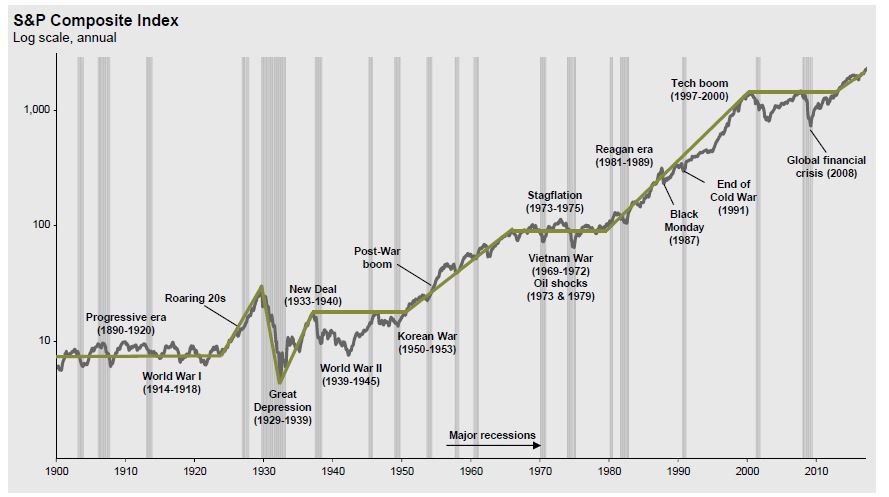
Where Are We Heading
First, we need to frame where we are. Our favorite graph shows the history of the S&P 500 over time in Log Scale. A pattern emerges in the data when viewed from a very high level. Periods of stagnated growth followed by periods of incredible growth. Interspaced throughout and represented in gray are economic downturns. Those downturns are present in both flat times and in major market upswings. There will be a recession where the markets take a dive. The question, is whether or not it will be the beginning of another wave of devastating financial stagnation, or if it will just be a blip in the road towards higher highs. We have moved far enough out of the wealth destroying 2000’s where we will likely be able to experience a recession and recovery and remain far above pre-financial crisis levels.
Second, we look to outside sources for a confirmation of our hypothesis, while doing our best to mitigate confirmation bias. We do not want to just go out searching for sources to verify our belief that the global economy is strengthening and we may be in the middle of a secular bull market. There is no amount of information we can intake that will somehow give us an answer to the direction or eventual stopping point for this market recovery, but it is important to understand where we get our beliefs.
Goldman Sachs in their 2018 global economic outlook research paper, As Good As It Gets:[i]
“For the first time since 2010, the world economy is outperforming most predictions, and we expect this strength to continue. Our global GDP forecast for 2018 is 4.0%, up from 3.7% in 2017 and meaningfully above consensus. The strength in global growth is broad-based across most advanced and emerging economies.”
The Federal Reserve, Minutes of the Federal Open Market Committee December 12-13, 2017:
“Movements in domestic financial asset prices over the inter-meeting period reflected slightly stronger-than expected economic data releases, announcements related to Treasury debt issuance, and an increase in the perceived probability that the Congress would enact tax legislation.”
The global economy appears to be shaking off the rust from years of below average growth. Inflation, which has stayed frustratingly low, as we addressed in our last quarterly update, is heating up. This will force the Federal Reserve to take more aggressive action in raising rates. Goldman Sachs believes the Fed will be more hawkish, aggressive with rates, than the markets are currently pricing in.
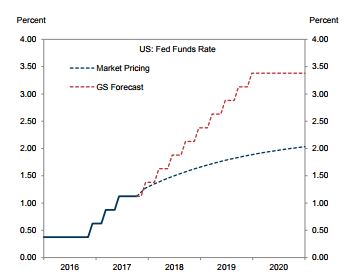
Source: Bloomberg, Haver Analytics, Goldman Sachs Investment Research
The Fed’s official stance at this time is for a series of increases during 2018. “The median projection of the year-end federal funds rate continued to rise gradually over the 2018-20 period. The median projection for the end of 2018 was 2.13%; the medians of the projections were 2.69% at the end of 2019 and 3.07 percent at the end of 2020.”[ii] As you can see from the graph above the Fed projections run short of the Goldman projection, but ahead of where the market is currently pricing rates.
The end of accomodative monetary policy is coming. This is a good thing as it represents a return to more free market movement as opposed to Quantitative Easing policy and government intervention.
Looking Forward
With global economic growth strengthening, the risks to investment portfolios appears to be more political than economic. There are a variety of risks which are impossible to price in:
- Indictment of President Trump.
- Impeachment of President Trump.
- Failure of NAFTA negotiations to create a cohesive agreement.
- Italian elections on March 4th.
- North Korea nuclear ambitions.
- Increase in Middle East instability
- Debt and Deficits.*
Debt and deficits would seem to be economic risks. They are included here because the failure to solve them is ultimately rooted in politics. We must begin to have rational discussions about our deficit. The effectiveness of monetary and fiscal policy can be constrained by significant debt and deficits making it hard to combat the recession(s) which will eventually come.[iii] Tax reform renewed talk on the deficit, but more in a macro sense. To give you an image of what the deficit really looks like and how challenging it is going to be to tackle we have included the graph below.
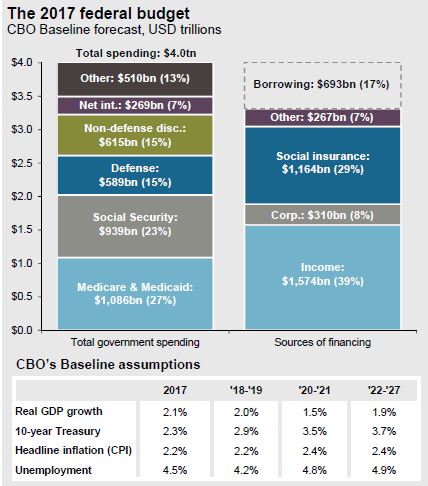
Source: CBO, JP Morgan Asset Management. 2017 Federal Budget is based on the Congressional Budget Office (CBO) June 2017 Baseline Budget Forecast. Other spending includes, but is not limited to, health insurance subsidies, income security and federal civilian and military retirement. Pease note that these estimated do not include the impacts of the Tax Cuts and Jobs Act of 2017.
The entire budget item for defense could be removed and we would still run a larger deficit on an annual basis than Bill Gates net worth. Dealing with debt is a risk which we view as both economic and political. The repercussions will be economic. The failure to deal with it political.
We are here to help you make rational, informed and well-reasoned decisions. We thank you for your continued trust and support. Your input is always welcome and we ask that you contact us with any questions or concerns.
DISCLOSURE
All information is believed to be from reliable sources; however we make no representation as to its completeness or accuracy. All economic and performance data is historical and not indicative of future results. Market indices discussed are unmanaged. Investors cannot invest in unmanaged indices. Additional risks are associated with international investing, such as currency fluctuations, political and economic instability and differences in accounting standards.
Investing in securities in emerging markets involves special risks due to specific factors such as increased volatility, currency fluctuations and differences in auditing and other financial standards. Securities in emerging markets are volatile and can decline significantly in response to adverse issuer, political, regulatory, market, or economic developments.
An index is a statistical measure of change in an economy or a securities market. In the case of financial markets, an index is an imaginary portfolio of securities representing a particular market or a portion of it. Each index has its own calculation methodology and is usually expressed in terms of a change from a base value. Thus, the percentage change is more important than the actual numeric value. An investment cannot be made directly into an index.
Investing in fixed income securities involves credit and interest rate risk. When interest rates rise, bond prices generally fall. Investing in commodities may involve greater volatility and is not suitable for all investors. Investing in a non-diversified fund that concentrates holdings into fewer securities or industries involves greater risk than investing in a more diversified fund. The equity securities of small companies may not be traded as often as equity securities of large companies so they may be difficult or impossible to sell. Neither diversification nor asset allocation assure a profit or protect against a loss in declining markets. Past performance is not an indicator of future results.
Securities offered through 1st Global Capital Corp., Member FINRA and SIPC. Steven W. Pollock, Sean P. Storck, Matthew J. Anderson and Nicole Albrecht are Registered Representatives of 1st Global Capital Corp. Investment advisory services, including RBFI portfolios offered through Reason Financial. IMS platform accounts offered through 1st Global Advisors, Inc. Reason Financial. and 1st Global Capital Corp. are unaffiliated entities. Reason Financial is a Registered Investment Adviser. Placing business through 1st Global Insurance Services. Registration does not imply a certain level of skill or training. We currently have individuals licensed to offer securities in the states of Arizona, California, Illinois, Indiana, Kansas, Massachusetts, Michigan, New York, Oregon and Washington. This is not an offer to sell securities in any other state or jurisdiction. CA Department of Insurance License: Steven W. Pollock #OE98073, Sean P. Storck #0F25995, Matthew J. Anderson #0F21959 and Nicole Albrecht #0F99962.
Copyright © 2017 Reason Financial all rights reserved.
Reason Financial
4747 Morena Blvd, Suite 102, San Diego, CA 92117
ENDNOTES
[i] Hatzius, Jan, et al. “As Good As It Gets.” GS Research 2018 Global Economic Outlook, Goldman Sachs, 15 Nov. 2017, www.goldmansachs.com/our-thinking/pages/macroeconomic-insights-folder/2018-global-economic-outlook-as-good-as-it-gets/report.pdf.
[ii] “Minutes of the Federal Open Market Committee December 12-13 2017.”Www.federalreserve.gov, 3 Jan. 2018, www.federalreserve.gov/monetarypolicy/files/fomcminutes20171213.pdf.