January 2017 – An Economic and Market Update
AN ECONOMIC AND MARKET UPDATE
Quarterly Market Update – October 2016
![]()
- 2016 stock market performance was up across the board despite the shock of two surprising political outcomes in both the U.K. and the U.S.
- Markets seem to be moving upward on the assumption that talk of lower taxes and fewer regulations will result in economic growth.
- A long-term trend of employment shifts from smaller to larger employers has significant consequences for the economy at large. Labor productivity, wage growth and innovation have all been impacted by this broad pattern.
- The next major event on the calendar is the French presidential election in April and May, with potential for global repercussions.
LOOKING BACK

2016 was quite a year. Most Americans will probably remember where they were and what they were doing when it became apparent that the next President of the United States would be Donald Trump. The same can likely be said for citizens of the United Kingdom on the circumstances surrounding the “Brexit” vote and decision to leave the European Union.
Surprises aside, as the chart indicates, markets were quite positive on the whole. It is not often all major asset classes post gains, but last year was one of those years. International Developed Market stocks were the laggard coming in at a meager 1.5% gain on the year. It was a good year considering the initial expectations following each of the aforementioned events.
SO WHY IS THE STOCK MARKET STILL HEADING UP
Domestic markets have moved significantly higher since the election on November 7th. Trying to piece together a narrative for why markets move is challenging at best, but we will give it a shot.
It appears there is a belief that a return of “Traditional” Republican values in 3 specific areas will drive long-term growth: lower taxes, smaller government (regulation) and encouragement of business growth (especially small-businesses). President-elect Trump has advocated these three values in various speeches, tweets and announcements. The narrative works well because small-businesses are an important part of a healthy economy and lower taxes and less regulation reduce costs for smaller firms.[i],[ii]
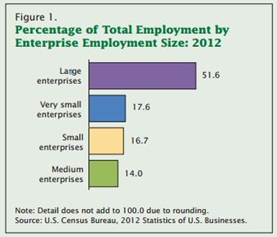
Small to mid-size enterprises now represent less than half of the employment in the country at 48.4% of total employment. Large enterprises are defined as employing greater than 500 employees. The share of employment by smaller employers has been declining steadily since at least 1993. There are various data points for this statistic at the U.S. Census Bureau and the Bureau of Labor Statistics with differences in employment totals. However, they both corroborate the increase in employment share of large enterprises relative to small enterprises.[iii]’[iv]
DOES THIS SHIFT FROM SMALL TO LARGE MATTER? (warning: lots of graphs ahead)
In October of 2016 the NBER, National Bureau of Economic Research, held a conference on entrepreneurial activity in the United States. Contrary to the general feeling we have that startup activity is increasing due to the prominence of tech companies and television shows like Shark Tank, entrepreneurship has been declining in the United States:
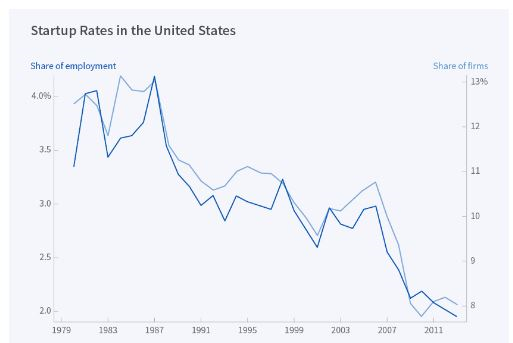 Source: Business Dynamics Statistics
At the conference it was noted by members of the NBER that, “Entrepreneurship is an important contributor to productivity growth in the American economy, and there is currently concern that American entrepreneurship is in serious decline.” This matters to society as a whole because research has shown that productivity grows more rapidly at young firms than at their more established counterparts.[v]
“Correlation does not imply causation.” When looking at broad trends in the economy and trying to connect the dots, we do not want to make big leaps of logic from one data point to another. However, during the period in which small firm start-ups have been lagging, real and nominal wages have been diverging (see next page for graphical illustration), and real wage growth and labor productivity have diverged as well.[vi]
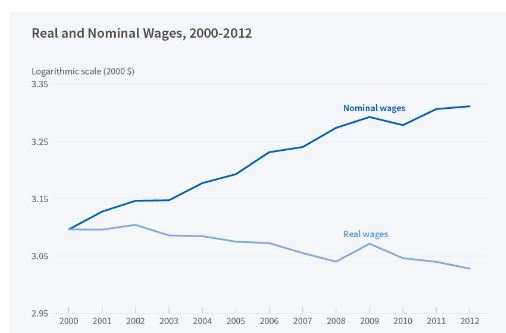
Source: M. Beraja, E. Hurst, and J. Ospina, NBER Working Paper No. 21956
During that divergence, output per worker has taken a dive and GDP growth has run well below average. For context, you should think of Real Wages as your standard of living and Nominal Wages as what you get paid.[vii]
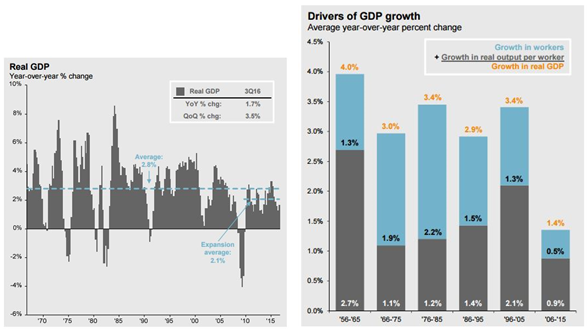
Source: J.P. Morgan Asset Management; Bureau of Labor Statistics, GDP Drivers are calculated as the average annualized growth between 4Q of the first and last. Guide to the Markets – U.S. Data are as of December 31, 2016
Past updates have included the Real GDP graph above left. The current expansion of Real GDP is significantly below the historic average. On a rolling 10 year average the expansion as represented by the chart on the right is significantly below the previous 5 decades by a wide margin. “Growth-in-workers” and “Growth-in-real-output-per-worker” has been less than half of previous decades.[viii]
CAN THIS BE FIXED?
While investors benefit from stock market growth, society as a whole benefits from Real GDP growth. A simple analogy here is to think of pie: stock market growth puts more of the pie in the hands of investors while Real GDP growth is where we scrap the old small pie for a new larger one for everyone. Stock market growth has not been followed by commensurate Real GDP growth and that is a problem. For those who don’t obsess over economics, GDP is calculated as follows:
GDP = C + G + I + NX
C stands for private consumption, which would be everything purchased by non-government sources. G represents the sum of Government Spending. I is the sum of net investment including business capital expenditures, think of items bought to be used for the long-term instead of just consumed. NX is the net exchange or Exports minus Imports. This is typically a net loss to GDP in the United States because we import so much stuff. [ix]
The stock market has been rising for the benefit of those who are invested, but at a time where the average American has less than $1,000 in their savings account this is a small consolation prize. Policies designed to stimulate small business growth and increase the size of the pie are welcome and should be pursued.[x]
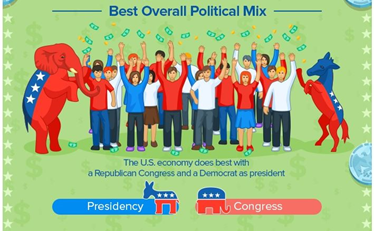
POLITICS AND ECONOMIC PERFORMANCE
In September of 2016 Wallethub.com attempted to answer this question: Which political party is better for the economy – Democrat or Republican?[xi]
The conclusion, after looking at historic data, we need both parties!
 Source: WalletHub.com
Stock markets since the election have not come to the same conclusion and have moved to record highs. We want to sound caution on this march upward to point out that economic measurements are much different from stock market measurements. Economists Alan Blinder and Mark Watson of Princeton University noted the following in their paper, Presidents and the U.S. Economy: An Econometric Exploration, “The answer, while hardly a secret, is not nearly as widely known as it should be. The U.S. economy performs much better when a Democrat is president than when a Republican is.” [xii]
In their attempt to explain the cause for the differences, Blinder and Watson make a statement which we believe is important to read in full:
“It seems we must look instead to several variables that are less closely tied to U.S. economic policy. Specifically, Democratic presidents have experienced, on average, better oil shocks than Republicans (some of which may have been induced by foreign policy), faster growth of defense spending (if the Korean War is included), and a better record of productivity shocks (which may relate to many different policies). More tenuously, both in terms of sample size and statistical significance, Democratic presidents may have also benefited from stronger growth abroad.”
We are in a transition period with a significant shift in policy direction forecast. The impact of policy moves may not be known for quite some time, but it is important to take stock of the past and proceed with care. Monetary and Fiscal policy moves by the incoming administration will have an impact on the economy.
It appears, however, that what is more important than political association is the manner in which the aforementioned external factors impact economic growth. We should look for direction on continued development of U.S. energy independence, a little luck when it comes to global economic growth, and policy decisions with the goal to bring wage growth in line with productivity growth (see previous graphs on real wage stagnation).[xiii]
THE NEXT SHOE TO DROP
 On April 23, 2017 the primary election for the next President of France takes place. Just as in the United States, the election is frought with controversy. The top two candidates from the primary participate in a run-off election on May 7, 2017. A nationalist candidate named Marine Le Pen is positioned as the favorite to win the primary and move on to the final where she will be challenged by one of several other candidates. Currently she is not expected to win the final vote on the 7th of May, but after the outcomes of both the Brexit and the US Presidential election it is hard to trust the veracity of current polling mechanisms.[xiv]
The risk here is one of stability. With the UK leaving the European Union, stability in continental Europe is reliant upon France and Germany. If a Nationalist candidate wins in France and begins to push for a “Frexit” all bets are off on the continued existence of the European Union. Significant hindrances to economic growth would be pushed to the top and trade agreements, movement of labor, movement of immigrants, currency stability, access to markets and other issues would come to bear.
LOOKING FORWARD
There is a lot of good to look at in our economy. Unemployment is low, job creation is high, real estate prices have rebounded, housing is incredibly affordable (if you can be a buyer instead of a renter), housing starts have increased, and amongst other things we have an incoming administration focused on one thing the outgoing administration was also focused on – infrastructure.
We think it is important to look at the negatives with the positives and maintain the very American ideal of believing that a solution can be found to any problem. We are maintaining our outlook for early 2017 as previously stated back in October. We believe we are in a period of heightened risk to the markets at this time. We will be rebalancing as our criteria are met and using market volatility as an opportunity to meet the cash and investment needs of our clients.
We thank you for your continued trust and support. Your input is always welcome and we ask that you contact us with any questions or concerns.
DISCLOSURE
All information is believed to be from reliable sources; however we make no representation as to its completeness or accuracy. All economic and performance data is historical and not indicative of future results. Market indices discussed are unmanaged. Investors cannot invest in unmanaged indices. Additional risks are associated with international investing, such as currency fluctuations, political and economic instability and differences in accounting standards.
Investing in securities in emerging markets involves special risks due to specific factors such as increased volatility, currency fluctuations and differences in auditing and other financial standards. Securities in emerging markets are volatile and can decline significantly in response to adverse issuer, political, regulatory, market, or economic developments.
An index is a statistical measure of change in an economy or a securities market. In the case of financial markets, an index is an imaginary portfolio of securities representing a particular market or a portion of it. Each index has its own calculation methodology and is usually expressed in terms of a change from a base value. Thus, the percentage change is more important than the actual numeric value. An investment cannot be made directly into an index.
Investing in fixed income securities involves credit and interest rate risk. When interest rates rise, bond prices generally fall. Investing in commodities may involve greater volatility and is not suitable for all investors. Investing in a non-diversified fund that concentrates holdings into fewer securities or industries involves greater risk than investing in a more diversified fund. The equity securities of small companies may not be traded as often as equity securities of large companies so they may be difficult or impossible to sell. Neither diversification nor asset allocation assure a profit or protect against a loss in declining markets. Past performance is not an indicator of future results.
Securities offered through 1st Global Capital Corp., Member FINRA and SIPC. Bruce Rawdin-Baron, Steven W. Pollock, Sean P. Storck, Matthew J. Anderson and Nicole Albrecht are Registered Representatives of 1st Global Capital Corp. Investment advisory services, including RBFI portfolios offered through Reason Financial. IMS platform accounts offered through 1st Global Advisors, Inc. Reason Financial. and 1st Global Capital Corp. are unaffiliated entities. Reason Financial is a Registered Investment Adviser. Placing business through 1st Global Insurance Services. Registration does not imply a certain level of skill or training. We currently have individuals licensed to offer securities in the states of Arizona, California, Illinois, Indiana, Kansas, Massachusetts, Michigan, New York, Oregon and Washington. This is not an offer to sell securities in any other state or jurisdiction. CA Department of Insurance License: Bruce Rawdin-Baron #0736631, Steven W. Pollock #OE98073, Sean P. Storck #0F25995, Matthew J. Anderson #0F21959 and Nicole Albrecht #0F99962.
Copyright © 2017 Reason Financial all rights reserved.
Reason Financial
4747 Morena Blvd, Suite 102, San Diego, CA 92117
ENDNOTES
[i] “Republican Platform 2016”, www.gop.com
[ii] “Small Businesses, Job Creation and Growth: Facts, Obstacles and Best Practices.” https://www.oecd.org/cfe/smes/2090740.pdf
[iii] Bureau of Labor Statistics, “Productivity and Costs, Third Quarter 2016, Revised”, www.bls.gov
[iv] Caruso, Anthony, “Statistics of U.S. Businesses Employment and Payroll Summary: 2012”. February 2015. www.census.cov
[v] Adelino, Manuel and Robinson, David T., Conference on Entreprenurship and Economic Growth October 14-15, 2016. http://www.nber.org/Entrepreneurship/entrepreneurship.html
[vi] “Correlation does not imply causation.” Wikipedia: The Free Encyclopedia. Wikimedia Foundation, Inc. 13 December 2016. Web. 13 January 2017
[vii] Beraja M., Hurst E., Ospina J., “NBER Working Paper NO. 21956” in “Economists Increasingly Using Cross-Regional Variations in Pursuit of Macroeconomic Insights.” www.nber.org
[viii] Guide to the Markets, J.P. Morgan Asset Management, Source Data as of 12/31/16
[ix] What is ‘Gross Domestic Product – GDP’, www.investopedia.com
[x] Becker, Sam. “How Much Money Does the Average American Have in Their Bank Account.” www.cheatsheet.com . 07 December 2016
[xi] Bernardo, Richie. “Which Party Is Better for the Economy? – WalletHub Study.” 26 September 2016. https://wallethub.com/edu/which-party-is-better-for-the-economy/24468/
[xii] Blinder, Alan S. and Watson, Mark W. “Presidents and the U.S. Economy: An Econometric Exploration.” July 2015. https://www.princeton.edu/~mwatson/papers/DemRep_BlinderWatson_July2015.pdf
[xiii] The Economist. “Timing is Everything.” 9 August 2014. http://www.economist.com/news/united-states/21611143-why-economy-has-grown-faster-under-democratic-presidents-timing-everything
[xiv] Pedder, Sophie. “The Fight for France.” http://www.theworldin.com/edition/2017/article/12593/fight-france